Illumitex
A Connected Interior Farm
In 2019, we used technology to navigate to the store or communicate for work, but when it came to interior agriculture, the industry had yet to digitize. In our research and interviews, our target demographic within the farm industry commonly relied on clipboards, feet on the ground, and phone calls to convey and relate information.
I was part of a team at Illumitex—a well-known LED lighting supplier in the grow-space—that aimed to digitize and streamline the growing process.

Client
Illumitex
Date
2019 - 2021
Role
Lead UI/UX & Product Designer
• Sketch • Adobe After Effects • Adobe Illustrator • HTML/CSS/Javascript
Tools
The Challenge
After talking with farmers, farm-owners, and other stakeholders, it was clear that a lot of farms had a deeply ingrained processes that would be difficult to change with one quick technology fix or application.
With so much information inherently present in every farm, it was clear why farms had been slow to digitize their systems. While Illumitex’s imaging technology brought all of that information to the cloud, allowing it to be processed and synthesized, there was still a deep need for that data to be easily digestible and usable.
My Role
I was the lead and only designer of the web-app for the FarmvisionAI platform from March 2019 to December 2020 when the company had to close its doors. I collaborated with the Director of Software and IoT Lead on the web-app which launched summer of 2019 and then with the Director of Software and various other team members on the introduction of our web app V2-3.
The Kickoff
When I was brought on the project, we had ideas about what the platform may do or be capable of, but we only had plain, live images of an active grow. I studied to learn the most I could about the growing pain points, what we were trying to solve, and who the audience would be.

It was clear from the start that this would be a difficult visual design problem as our users often seemed hesitant when interfaces felt too “polished,” “fancy,” or anything that seemed to match the current techno-visual landscape. It was daunting as a designer fluent in Apple’s Human Interface Guidelines and Google’s Material Design Guidelines. It seemed much of my design sensibilities would not convey. Researching the current landscape of agricultural-based software, I relied on industrial bare-bone interfaces that resonated more with our target audience.
Navigate as if Omniscient
A lot of indoor growing facilities struggle with physical plant access. Workers have to walk from grow-bed to grow-bed in order to check for disease and harvestability. With the advent of our cameras, it was mind-blowing to be able to see all of this plant imagery so clearly. We wanted a way to be able to navigate those images fluidly.
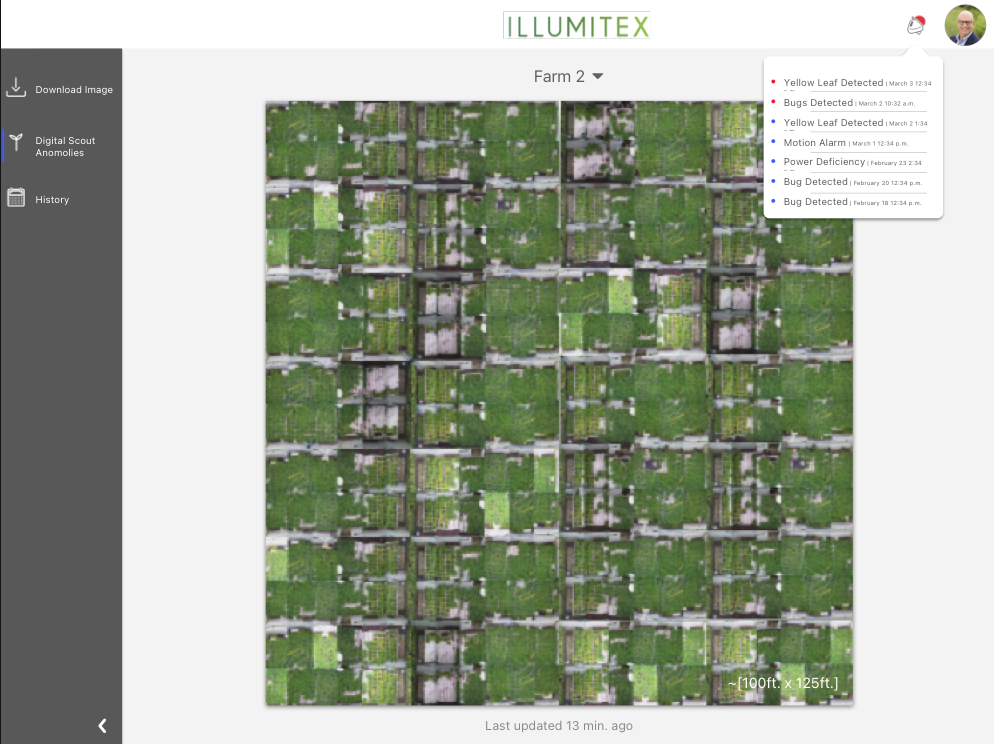
It quickly became evident that what had started as click-down interface (that moved into deeper detail the farther you clicked through), needed to move to something more advanced. I researched different image-navigation methods before finally settling on a Google Earth-like interface that would allow the user to seamlessly pan and zoom around the grow.

Loss of Context
A problem I didn’t foresee was the loss of context that would result when all of the images were batched together. Users (and even the team) had difficulty orienting themselves in the room. Interior grow sights could be as small as a self-contained shipping container, or as a big as a vertical grow in a warehouse with multiple beds stacked on top of each other.
The solution came in the form of waypoints similar to how you might see a restaurant or store shown on a map. This revelation made us realize that we needed to push the idea even further. We had previously embedded the AI “Data Scout” data on top of the images so they were not dynamically tied together, but rather static images without context. By making the data serialized, we opened a whole new avenue of charts, dynamic contexts, and synthesis we would not previously have had access to.
Finding the Right Information
With all of this new information at our fingertips, we had to dig deeper into client surveys and stories in order to discern what would be most helpful. We had previously used a form of “widgets” that would show different contextual information, but with this new influx of data it was clear we would have to design a system to prioritize.
With more metrics available such as:
• Grows over time
• New health and harvest detections
• Weather
• Daily reports
It was clear we needed to start working towards a version 3.
I animated a short commercial to show off the features to investors and potential customers.


Awards
Honorable mention in Fast Company’s Innovation by Design — Best Data Design of 2020 among finalists including MIT-IBM, Ikea, The New York Times, Pentagram, Salesforce, and other esteemed companies.
Greenhouse Grower — Technology of the Year 2020
CropLife — Best Agriculture Apps for 2021
The Impact
The story unfortunately has a sad ending. As we launched version 3, the company started to begin the process of closing. Illumitex was as an LED light manufacturer that had started FarmvisionAI to modernize their own business pursuits, a startup inside a larger company. While we didn’t get time to test our impact, the small amount of feedback we did receive was encouraging. The world of agriculture technology is ripe for modernization that can help the industry become more economically and environmentally efficient. I’m curious to follow its bright future.